When I load an exe-file into the debugger, I get the same error message "Error: objdump.exe must be in the directory of fbdebugger", but the debugger seems to work. What does this error message mean? Where can I get objdump.exe? Or should I go back to the previous stable version of fbdebugger (fbdebug_2013_10_27.zip)? In this version, this error does not occur.Roland Chastain wrote:Excellent! Thank you SARG.
I made what you said first, and FBDebugger indicates this line as a possible error:
Very strong! I still haven't understood the error but I am glad to see how FBDebugger works.Code: Select all
select case myIni.ReadString("interface", "language", "")
After I drag-and-dropped my exe, I had this message: "Error: objdump.exe must be in the directory of fbdebugger"
FB debugger : 3.02 32/64 BIT WDS/LNX..... (2023/07/05)
-
Lothar Schirm
- Posts: 496
- Joined: Sep 28, 2013 15:08
- Location: Germany
Re: FB debugger : 2.80 (september 21th, 2014)
Re: FB debugger : 2.80 (september 21th, 2014)
Hi,
In fact objdump is a very interesting tool used here to disassemble or to extract debugging data ('dwarf', case if gcc is used but not gas).
Unfortunately it's possible that some parts of code added by the compiler contain dwarf data so the function extracting this type of debugging data is uselessly called. If objdump doesn't exist the function returns immediatly and it doesn't matter because that data isn't used.
Special case : mixed codes (gcc and gas) eg main program and dll or library both with -g option.
In the next version I'll change the message in order to better explain what is really happening.
By the way, I have used your good tutorial for FLTK. Thanks.
I'm preparing all I need, to replace windows API calls in fbdebugger. :-)
This message means, obviously, that objdump is missing ;-)Lothar Schirm wrote:When I load an exe-file into the debugger, I get the same error message "Error: objdump.exe must be in the directory of fbdebugger", but the debugger seems to work. What does this error message mean?"
In fact objdump is a very interesting tool used here to disassemble or to extract debugging data ('dwarf', case if gcc is used but not gas).
Unfortunately it's possible that some parts of code added by the compiler contain dwarf data so the function extracting this type of debugging data is uselessly called. If objdump doesn't exist the function returns immediatly and it doesn't matter because that data isn't used.
Special case : mixed codes (gcc and gas) eg main program and dll or library both with -g option.
In the next version I'll change the message in order to better explain what is really happening.
It's easily found in the GCC panoply. Or I can upload a version in freebasic-portal.de.Lothar Schirm wrote: Where can I get objdump.exe?
No, use the last version and do not hesitate to ask for help.Lothar Schirm wrote:should I go back to the previous stable version of fbdebugger (fbdebug_2013_10_27.zip)? In this version, this error does not occur.
By the way, I have used your good tutorial for FLTK. Thanks.
I'm preparing all I need, to replace windows API calls in fbdebugger. :-)
-
Lothar Schirm
- Posts: 496
- Joined: Sep 28, 2013 15:08
- Location: Germany
Re: FB debugger : 2.80 (september 21th, 2014)
Thank you. I have downloaded objdump.exe, the error message does not appear. Perhaps you could include objdump.exe in your nest release of fbdebug?
Nice that you want use FLTK! Good success!
Nice that you want use FLTK! Good success!
Re: FB debugger : 2.80 (september 21th, 2014)
Hi SARG,
does FBdebugger allow to view the contents of the CPU registers (especially EAX to view the return value of a function) ?
Or does it have any other feature that allows to do that?
I couldn't find it.
edit: and another feature request: it would be nice if variable values (maybe also variable names??) could be copied into the clipboard (Ctrl+C).
Re: FB debugger : 2.80 (september 21th, 2014)
Hi St_W,
But as it was interesting I have quickly coded a new function doing what you want, I hope.
I'll integrate it later but for now I suggest to reuse an existing option:
Just change the text of the item menu by "Show return value" in
Then comment the line or replace by the call of retval_show
To use : select the proc name or any variable of the proc (tab proc/var) and select the new option "Show return value" in the contextual menu.
For testing :
Edit : Copy to the clipboard.
Change the procedure procvar_list by the following (not a lot of change).
Now when you select "List selected proc/var" only one line is displayed in the log and also copied into the clipboard.
As previously I'll do in a cleaner way later, I guess a new version will be released this weekend.
I believe currently there is no way. The easiest solution is to add a variable containing the return value ;-)St_W wrote:does FBdebugger allow to view the contents of the CPU registers (especially EAX to view the return value of a function) ?
Or does it have any other feature that allows to do that?
I couldn't find it.
But as it was interesting I have quickly coded a new function doing what you want, I hope.
Code: Select all
Sub retval_show '19/11/2014
		Dim As Integer hitem,temp,typ
		Dim As UInteger addr

	If tviewcur<>tviewvar Then
		fb_message("Return value","Use this feature only in proc/var tab !!")
	EndIf
	'get current hitem in tree
	temp=sendmessage(tviewcur,TVM_GETNEXTITEM,TVGN_CARET,NULL)
	Do 'search index proc
		hitem=temp
		temp=SendMessage(tviewcur,TVM_GETNEXTITEM,TVGN_PARENT,hitem)
	Loop While temp
	temp=0
	For i As Integer =1 To procrnb
		If procr(i).tv=hitem Then
			temp=procr(i).idx
			addr=procr(i).sk
         Exit For
		EndIf
	Next
	If temp=0 Then fb_message("Return value","Global variables no proc associated !!"):Exit Sub '27/01/2013
	typ=proc(temp).rv
	if typ=7 and proc(temp).pt=0 then fb_message("Return value","Select a function not a sub !!"):Exit Sub

	If proc(temp).pt Then 'pointer  type doesn't matter
		addr-=4
	Else
		If typ=13 Then 'string
			addr-=12
		Else 'other type without pointer
			If typ>14 Then 'udt
				typ=7
				addr+=8
			Else
				If udt(proc(temp).rv).lg>4 Then
					addr-=8
				Else
					addr-=4
				EndIf
			EndIf
		EndIf
	EndIf
	fb_message("Addr return value"+Str(addr),"proc name="+proc(temp).nm+Chr(13)+"no information about pointer just return value type="+udt(proc(temp).rv).nm+Chr(13) _
	+var_sh2(typ,addr,proc(temp).pt,""))
End SubJust change the text of the item menu by "Show return value" in
Code: Select all
menu_option(menuvar,IDVEXPND, "Expand proc/var")Code: Select all
        Case IDVEXPND 'expand
               'proc_expcol(TVE_EXPAND)
retval_show '19/11/2014For testing :
Code: Select all
Type tudt
	intg As Integer
	ulgt As ULongInt
	stg As String
End Type
Dim As tudt  udt
Sub subsub()
	Print "sub"
End Sub
Function spe() As Any Ptr
	Return @spe
End Function
Function test(prm As integer)As Integer
	Return prm*2
End Function
Function test2(prm As integer)As String
	Return Str(prm*4)
End Function
Function test3(prm As integer)As UByte
	'Dim As UByte ubt=prm*2
	Return prm*2
End Function
Function test4(prm As integer)As ULongInt
	'Dim As ulongint ulg=prm*3
	Return prm*3
End Function

Function test5(prm As integer)As Sub()
	Return @subsub
End Function
Function test6(prm As integer)As ULongInt Ptr
	Dim As ulongint ulg
	'Print @ulg
	Return @ulg
End Function
Function test7(prm As integer)As tudt
	Dim As tudt udt
	udt.intg=789
	udt.stg="test"
	Return udt
End Function
Function test8(prm As integer)As Double
	'Dim As double dbl=prm*3
	Return prm*3
End Function

Dim sudt As tudt
subsub
Print spe
Print test(25)
Print test2(25)
Print test3(25)
Print test4(25)
Print test5(25)
Print test6(25)
sudt=test7(25)
Print test8(25)
SleepI'll see this point later but I guess that's not very difficult to add it.St_W wrote:edit: and another feature request: it would be nice if variable values (maybe also variable names??) could be copied into the clipboard (Ctrl+C).
Edit : Copy to the clipboard.
Change the procedure procvar_list by the following (not a lot of change).
Now when you select "List selected proc/var" only one line is displayed in the log and also copied into the clipboard.
As previously I'll do in a cleaner way later, I guess a new version will be released this weekend.
Code: Select all
Sub procvar_list(t As Integer=0)
	Dim tvi As TVITEM,text As ZString *100, pr As Integer
	Dim As Integer hitem,temp,level,iparent,inext

	Dim As hwnd hedit '19/11/2014

	If t=1 Then
		'get current hitem in tree
		hitem=sendmessage(tviewvar,TVM_GETNEXTITEM,TVGN_CARET,NULL)
		iparent=SendMessage(tviewvar,TVM_GETNEXTITEM,TVGN_PARENT,hitem)
		inext=SendMessage(tviewvar,TVM_GETNEXTITEM,TVGN_NEXT,hitem)
	Else
		'root
		hitem=sendmessage(tviewvar,TVM_GETNEXTITEM,TVGN_ROOT,NULL)
		iparent=0
		inext=0
	EndIf

	While hitem<>0
		tvI.mask       = TVIF_TEXT Or TVIF_STATE
		tvI.hitem      = Cast(HTREEITEM,hitem)
		tvI.pszText    = @(text)
		tvI.cchTextMax = 99
		sendmessage(tviewvar,TVM_GETITEM,0,Cast(LPARAM,@tvi))
		'#Ifdef fulldbg_prt 08/06/2014
			dbg_prt(Space(level*4)+text)
		'#EndIf
		If t=1 Then
			hedit=fb_edit("",windmain,1234,0,0,0,0,0,ES_MULTILINE Or ES_WANTRETURN)'19/11/2014
			setwindowtext(hedit,text)
			sendmessage(hedit,EM_SETSEL,0,-1)
			sendmessage(hedit,WM_COPY,0,0) 'copy text in the clipboard
			sendmessage(hedit,EM_SETSEL,-1,0)
			DestroyWindow (hedit)
			Exit sub
		EndIf
		temp=SendMessage(tviewvar,TVM_GETNEXTITEM,TVGN_CHILD,hitem)
		level+=1
	   While temp=0
			temp=SendMessage(tviewvar,TVM_GETNEXTITEM,TVGN_NEXT,hitem)
			If temp<>0 Then
				If inext=temp Then Exit While,While
				level-=1:Exit While
			EndIf
			hitem=SendMessage(tviewvar,TVM_GETNEXTITEM,TVGN_PARENT,hitem)
			level-=1
			If hitem=iparent Then Exit While,While
	   Wend
	   hitem=temp
	Wend

End SubRe: FB debugger : 2.80 (september 21th, 2014)
Hi SARG,
thank you for the quick answer and already some solutions! I haven't tried them yet because I just changed my program to store the return value in a temporary variable instead of just writing the calculating expression in the return statement.
Additionally, I used the "show/expand variable" command very often. It's the simplest way I found to show the dump of a (dereferenced) pointer variable. Or is there any easier way to derefence a pointer and show that address in the dump?
By the way I think there's a problem with the dump: Unfortunately I don't really know whether I've found a way to reproduce it, but if I switch in the dump from "Dec" display to "Hex" it just shows "Error" in all fields. As soon as I select another datatype it works (also if I select the original datatype (uInteger) again). You may try this (and hopefully you can reproduce it this way):
Use the following code, compile with "-s console -g" fbc 1.00 or fbc 0.91 (other versions may also work, but I've tried just these two):
Load the EXE into FbDebugger and step until you've passed the allocation in the constructor.
Select the HEAP var in "Proc/var" tab under "ThID=..." -> "THIS ..." and then right click and select "show/expand variable".
In the popup window select the pointee ("<void> = ...") and then click "Dump" on the right and close the popup window.
Finally right click on the dump-area (the "Manage dump" popup window appears) and select "Hex".
All values show "Error".
As soon as you select "uInteger" again it works.
And yet another little wish: It would be nice if the dump would use a fixed-width font.
edit: some other nice-to-have features I can think of while using it:
Allow to directly not only dump variable, but - in case of pointers - dump dereferenced pointer variable.
Allow to copy values in memory dump to clipboard (introduce context menu)
"Goto address" context-menu command in memory dump if right click on an address (32-bit value).
Maybe also allow to edit memory contents in memory dump?
Scrollbar in memory dump (maybe without scrollbar, but up/down arrows and mouse wheel)
Of course some of these ideas will be quite difficult/costly to implement; so take it just as ideas and drop the ones you think that are too hard to implement ;-)
Thank you SARG for all the effort you put into FbDebugger!
thank you for the quick answer and already some solutions! I haven't tried them yet because I just changed my program to store the return value in a temporary variable instead of just writing the calculating expression in the return statement.
Additionally, I used the "show/expand variable" command very often. It's the simplest way I found to show the dump of a (dereferenced) pointer variable. Or is there any easier way to derefence a pointer and show that address in the dump?
By the way I think there's a problem with the dump: Unfortunately I don't really know whether I've found a way to reproduce it, but if I switch in the dump from "Dec" display to "Hex" it just shows "Error" in all fields. As soon as I select another datatype it works (also if I select the original datatype (uInteger) again). You may try this (and hopefully you can reproduce it this way):
Use the following code, compile with "-s console -g" fbc 1.00 or fbc 0.91 (other versions may also work, but I've tried just these two):
Code: Select all
Type Heap

Private:
	Dim heap As Any Ptr
	Dim heapSz As UInteger

Public:
	Declare Constructor()
	Declare Destructor()

End Type


Constructor Heap()
	'heap of size 32 Kbytes
	this.heapSz = 32*1024
	this.heap = Allocate(heapSz)
	?"heap constructed"
End Constructor

Destructor Heap()
	DeAllocate(this.heap)
	this.heap = 0
	?"heap destroyed"
End Destructor

Dim Shared h As Heap
?"finished"
Select the HEAP var in "Proc/var" tab under "ThID=..." -> "THIS ..." and then right click and select "show/expand variable".
In the popup window select the pointee ("<void> = ...") and then click "Dump" on the right and close the popup window.
Finally right click on the dump-area (the "Manage dump" popup window appears) and select "Hex".
All values show "Error".
As soon as you select "uInteger" again it works.
And yet another little wish: It would be nice if the dump would use a fixed-width font.
edit: some other nice-to-have features I can think of while using it:
Allow to directly not only dump variable, but - in case of pointers - dump dereferenced pointer variable.
Allow to copy values in memory dump to clipboard (introduce context menu)
"Goto address" context-menu command in memory dump if right click on an address (32-bit value).
Maybe also allow to edit memory contents in memory dump?
Scrollbar in memory dump (maybe without scrollbar, but up/down arrows and mouse wheel)
Of course some of these ideas will be quite difficult/costly to implement; so take it just as ideas and drop the ones you think that are too hard to implement ;-)
Thank you SARG for all the effort you put into FbDebugger!
Re: FB debugger : 2.80 (september 21th, 2014)
Value "error" displayed in the listview perhaps data too big/small for the type, I have to search a bit.....
Columns must be resized (programmaticaly) as for example -125 is too large and not displayed. Although it's possible to enlarge using the mouse.
Read a faw the user's manual. ;-)
Too tired to continue, more anwwers tomorrow.
To get monospace font change in Function fb_listviewSt_w wrote:It would be nice if the dump would use a fixed-width font
Code: Select all
SendMessage(A,WM_SETFONT,Cast(WPARAM,fb_Set_Font("Courier New",8)),0)'19/11/2014When editing value you can directly see the pointed value and you can choose to dump it.St_w wrote:Allow to directly not only dump variable, but - in case of pointers - dump dereferenced pointer variable.
Right click on the dump area a dialog box gives you the possibility to enter any address. But I can retrieve a value in the list view and copy in the edit box to avoid doing it manually.St_w wrote:"Goto address" context-menu command in memory dump if right click on an address (32-bit value).
Context menu in source code area, option "manage breakpoint"......St_w wrote:Is there any way to show the breakpoint overview dialog (which is shown on program restart) to manage breakpoints?
The "full memory window" is not enough ?St_w wrote:Scrollbar in memory dump (maybe without scrollbar, but up/down arrows and mouse wheel)
Click on the header of a column to edit the corresponding value of the first line.St_w wrote:Maybe also allow to edit memory contents in memory dump?
Read a faw the user's manual. ;-)
Too tired to continue, more anwwers tomorrow.
Re: FB debugger : 2.80 (september 21th, 2014)
Hi all,
Following the St_w's requests new features about dump, in memory area (listview):
- left click on any cell to open a dialog box allowing to change the value.
- press ctrl key and left click on any cell in order to use the cell value as the new beginning address of dump. Obviously the type of the displayed data must be integer or uinteger (anyway it's verified).
3 modifications :
Change the declare
Search 'If LoWord(wparam)=IDDUMP Then'
Change totally dump_update
Following the St_w's requests new features about dump, in memory area (listview):
- left click on any cell to open a dialog box allowing to change the value.
- press ctrl key and left click on any cell in order to use the cell value as the new beginning address of dump. Obviously the type of the displayed data must be integer or uinteger (anyway it's verified).
3 modifications :
Change the declare
Code: Select all
Declare Sub dump_update(As NMITEMACTIVATE Ptr)'NMLISTVIEW '20/11/2014Code: Select all
Case WM_NOTIFY
    		If LoWord(wparam)=IDDUMP Then
        		'Dim lvp2 As NMLISTVIEW Ptr
        		'lvp2=Cast(NMLISTVIEW Ptr,lparam) 'click on one column so can change the value in memory
        		Dim lvp As NMITEMACTIVATE Ptr '20/11/2014
        		lvp=Cast(NMITEMACTIVATE Ptr,lparam)
        		If lvp->hdr.code=NM_CLICK Then
        			If dumpadr<>0 And prun Then dump_update(lvp)
        		EndIf
        		'If lvp->hdr.code =&hFFFFFF94 And dumpadr<>0 And prun Then dump_update(lvp2)'LVN_COLUMNCLICK
ElseIf LoWord(wparam)=TAB1 ThenCode: Select all
Sub dump_update(lvp As NMITEMACTIVATE  Ptr)'NMLISTVIEW 20/11/2014
Dim lvi As LVITEM,tmp As ZString *25,lvu As valeurs
lvI.mask     = LVIF_TEXT
lvi.iitem    = lvp->iitem'0 'first line
lvi.isubitem = lvp->isubitem 'index column
lvi.pszText  = @tmp
lvi.cchtextmax=24
SendMessage(listview1,LVM_GETITEM,0,Cast(LPARAM,@lvi))
If lvp->isubitem=lvnbcol+1 Orelse lvp->isubitem=0 Then fb_message("Change value error","Not possible with this column"):Exit Sub

If lvp->uKeyFlags=2 Then 'changing adr dump by the value in the selected case
	If lvtyp<>1 andalso lvtyp<>7 andalso  lvtyp<>8 Then fb_message("Changing address for memory dump","Only possible with integer and uinteger"):Exit Sub
	dumpadr=ValUInt(tmp)
	dump_sh()
	Exit Sub
EndIf

inputval=tmp
inputtyp=lvtyp
'fb_MDialog(@input_box,"Change value ["+tmp+"]",windmain,283,25,150,30)
fb_MDialog(@input_box,"Changing value in memory : Adr="+Str(dumpadr+(lvp->iitem)*16+(lvp->isubitem-1)*16\lvnbcol)+" (Line="+Str(lvp->iitem+1)+" / Column="+Str(lvp->isubitem)+")",windmain,283,25,200,30)

If inputval<>"" Then
    'fb_message("Change value in memory dump","Adr="+Str(dumpadr+(lvp->iitem)*16+(lvp->isubitem-1)*16\lvnbcol)+Chr(13)+"Line="+Str(lvp->iitem+1)+" / Column="+Str(lvp->isubitem)+Chr(13)+"New value = "+inputval)
    Select Case lvtyp
        Case 2
            lvu.vbyte=ValInt(inputval)
        Case 3
            lvu.vubyte=ValUInt(inputval)
        Case 5
            lvu.vshort=ValInt(inputval)
        Case 6
            lvu.vushort=ValUInt(inputval)
        Case 1
            lvu.vinteger=ValInt(inputval)
        Case 7,8
            lvu.vuinteger=ValUInt(inputval)
        Case 9
            lvu.vlinteger=ValLng(inputval)
        Case 10
            lvu.vulinteger=ValULng(inputval)
        Case 11
            lvu.vsingle=Val(inputval)
        Case 12
            lvu.vdouble=Val(inputval)
    End Select
    writeprocessmemory(dbghand,Cast(LPVOID,dumpadr+(lvp->iitem)*16+(lvp->isubitem-1)*16\lvnbcol),@lvu,16\lvnbcol,0)
    var_sh()
    dump_sh()
End If
End SubRe: FB debugger : 2.80 (september 21th, 2014)
Hi SARG!
I wanted to debug Unicode programs, but I did not succeed. FbDebugger not support unicode or i something wrong doing? Instead code, the following :

I wanted to debug Unicode programs, but I did not succeed. FbDebugger not support unicode or i something wrong doing? Instead code, the following :
Re: FB debugger : 2.80 (september 21th, 2014)
Hi VANYA,
But a quick solution :
In proc load_souces just change 'setwindowtest' by 'setwindowtextW' (2 lines).
The first displayed line contains strange characters, I guess that there is a header in the unicode file.
For now at work so not a lot of times for testing, maybe there are some other side effects ;-)
* '- ' and '+' to move one cell or one line
* '--' and '++' to move one line or one page
Currently only ascii text is possible.VANYA wrote:I wanted to debug Unicode programs, but I did not succeed. FbDebugger not support unicode or i something wrong doing? Instead code, the following :
But a quick solution :
In proc load_souces just change 'setwindowtest' by 'setwindowtextW' (2 lines).
The first displayed line contains strange characters, I guess that there is a header in the unicode file.
For now at work so not a lot of times for testing, maybe there are some other side effects ;-)
in a previous post I forgot to said : Right click open a dialog box with 4 buttons :St_W wrote:Scrollbar in memory dump (maybe without scrollbar, but up/down arrows and mouse wheel)
* '- ' and '+' to move one cell or one line
* '--' and '++' to move one line or one page
Re: FB debugger : 2.81 Beta 01 (november 30th, 2014)
Hi all,
A new version 2.81 B01 : http://users.freebasic-portal.de/sarg/FBdebugger.bas
Some requests by St_w.
- Changed
--> userfriendly display when an exception arises and especially for access violation (displaying all exceptions in same way)
--> monospaced font used for dump memory (St_w). Size of window should be resized for byte and ubyte (will be done in next release)
--> to change the value of any cell in dump memory : left click on it
--> more explicit error message when trying to display single or double in hex format
- Fixed
--> demangling to display correctly complete names when using namespaces
- Added
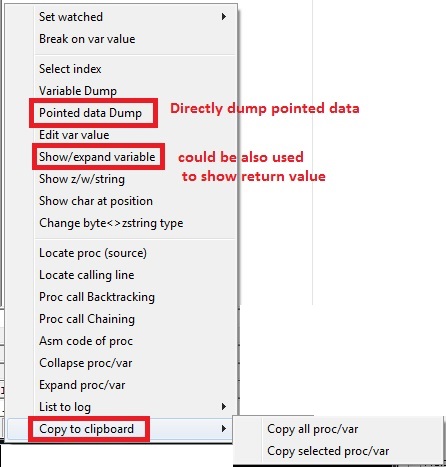
--> to show return value of a proc : use show/exp directly on the proc name (proc/var tab) (St_w)
--> to copy variable value in clipboard (all or only one with its childs) : select the new option, copy to clipboard, in contextual menu (St_w)
--> to show the dump of deferenced data : select new option, pointed data dump, in contextual menu (St_w)
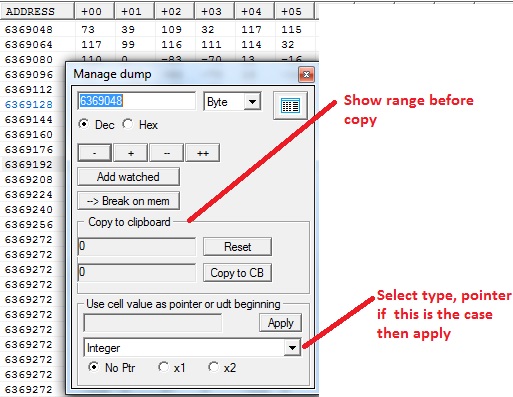
--> to copy dump into clipboard : shift+left click on one cell / on header for whole page / address area or ascii area for one line or multilines (St_w)
the dialog box to valid selection is automatically opened if currently closed
--> to change the beginning address of dump : ctrl + left click on one cell (data or address area), datatype must be integer/uinteger
--> to use the value in a cell as a pointer or directly as beginning of udt data in shw/exp : alt+left click on a cell then select no pointer or pointer and the datatype. The dialog box to valid selection is automatically opened if currently closed.
- work in progress :
--> display of the character at a given position in a string with possibility to move forward and backward.
--> unicode management for source codes.
--> linux version and use of fltk library
A new version 2.81 B01 : http://users.freebasic-portal.de/sarg/FBdebugger.bas
Some requests by St_w.
- Changed
--> userfriendly display when an exception arises and especially for access violation (displaying all exceptions in same way)
--> monospaced font used for dump memory (St_w). Size of window should be resized for byte and ubyte (will be done in next release)
--> to change the value of any cell in dump memory : left click on it
--> more explicit error message when trying to display single or double in hex format
- Fixed
--> demangling to display correctly complete names when using namespaces
- Added
--> to show return value of a proc : use show/exp directly on the proc name (proc/var tab) (St_w)
--> to copy variable value in clipboard (all or only one with its childs) : select the new option, copy to clipboard, in contextual menu (St_w)
--> to show the dump of deferenced data : select new option, pointed data dump, in contextual menu (St_w)
--> to copy dump into clipboard : shift+left click on one cell / on header for whole page / address area or ascii area for one line or multilines (St_w)
the dialog box to valid selection is automatically opened if currently closed
--> to change the beginning address of dump : ctrl + left click on one cell (data or address area), datatype must be integer/uinteger
--> to use the value in a cell as a pointer or directly as beginning of udt data in shw/exp : alt+left click on a cell then select no pointer or pointer and the datatype. The dialog box to valid selection is automatically opened if currently closed.
- work in progress :
--> display of the character at a given position in a string with possibility to move forward and backward.
--> unicode management for source codes.
--> linux version and use of fltk library
Re: FB debugger : 2.81 Beta 01 (november 30th, 2014)
I downloaded the program, compiled it using option -exx and the fbdebugger.rc I already had (using fbc version 0.91.0 on win7/64bit) and got a runtime error when loading a program (pushing button SELECT EXE/BAS and then selecting an executable).
When I leave out the -exx from the command line and compile fbdebugger the runtime error does not occur (the out of bounds array access does occur).
Looking at the code I'd say it's an 'off-by-one' error. Index runs from i to shcutnb while it should run from i to shcutnb -1. Same thing can be seen in line 5508. All other loops that use shcutnb in a loop condition use the condition shcutnb - 1 so I'm guessing that's the problem.
Line 5508 and line 5576 most likely contain 'off-by-one' errors.
Code: Select all
Aborting due to runtime error 6 (out of bounds array access) at line 5577 of fbdebugger2.bas::MENU_UPDATE()
Looking at the code I'd say it's an 'off-by-one' error. Index runs from i to shcutnb while it should run from i to shcutnb -1. Same thing can be seen in line 5508. All other loops that use shcutnb in a loop condition use the condition shcutnb - 1 so I'm guessing that's the problem.
Line 5508 and line 5576 most likely contain 'off-by-one' errors.
Re: FB debugger : 2.81 Beta 01 (november 30th, 2014)
@AGS
Thank you for having highlighted this issue.
With the previous versions it didn't matter but now as the maximal number of shortcuts is just reached the next addition of one menu option would have been more impactful.
I'll correct the 2 wrong lines and add a test to avoid exceeding limit.
By the way, more feedback about last improvements is welcome. ;-)
.
Re: FB debugger : 2.81 Beta 01 (november 30th, 2014)
Issue fixed and Unicode source code files should be now handled : http://users.freebasic-portal.de/sarg/FBdebugger.basAborting due to runtime error 6 (out of bounds array access) at line 5577 of fbdebugger2.bas::MENU_UPDATE()
I have tested with a file generated by fbedit (UTF16). If someone could check with other formats (at least UTF8).
By the way, more feedback about last improvements is welcome. ;-)
Re: FB debugger : 2.81 Beta 01 (november 30th, 2014)
I tried the UTF8 file from the /FREEBASIC_INSTALLATION_DIRECTORY/EXAMPLES/UNICODE/ and that worked. I added some UTF8 characters to that example (added a couple of multi-byte characters to a comment) and that worked out all right.
Only one small issue: at the top of the gui there is a line that says (when running the file from the examples directory)
So in that part of the gui the content of the wstring isn't shown correctly (" ,!" should have been a couple of Chinese characters).
Looking at the code it's the window text of hcurline that is causing the problem (code is in sub dsp_change, line
3226 and further).
The variable l has type zstring * 300. That could be causing the problems. If variable l would be type wstring * 300 then perhaps the text would show up correctly. setWindowText does not display unicode content.
The value of the wstring variable shows up correctly in
--> the source window
--> the message window as used in the example
--> when you use show z/w/string in the right hand pane of fbdebugger.
The example used (UTF8 encoded)
Only one small issue: at the top of the gui there is a line that says (when running the file from the examples directory)
Code: Select all
Current line [line_number]: dim helloworld as wstring * 20 => " , !"
Looking at the code it's the window text of hcurline that is causing the problem (code is in sub dsp_change, line
3226 and further).
Code: Select all
   sendmessage(dbgrichedit,EM_GETSELTEXT,0,Cast(LPARAM,@l))
   setWindowText(hcurline,"Current line ["+Str(curlig)+"]:"+LTrim(l,Any " "+Chr(9)))
The value of the wstring variable shows up correctly in
--> the source window
--> the message window as used in the example
--> when you use show z/w/string in the right hand pane of fbdebugger.
The example used (UTF8 encoded)
Code: Select all
''
'' "Hello World!" test, in UTF-8 format
''
''↨∑≤⌐

#ifdef __FB_WIN32__
# define unicode
# include once "windows.bi"
#endif

const LANG = "Chinese"
	dim helloworld as wstring * 20 => "你好,世界!"

	print """Hello World!"" in "; LANG; ": "; helloworld

#ifdef __FB_WIN32__
	messagebox( 0, helloworld, """Hello World!"" in " & LANG & ":", MB_OK )
#endif