- be based on cairo for high-quality screen, file and printer output (win32 and LINUX)
- use PangoCairo for system fonts and international characters (UTF-8)
- be modular, so the user can arrange his page by using a custom set of items (with one or more diagrams on a page)
- use GooCanvas for arranging the diagram items (in a graphical manner on the screen)
- GooAxis and
- GooCurve
Screenshots and corresponding source code
 60 LOC:
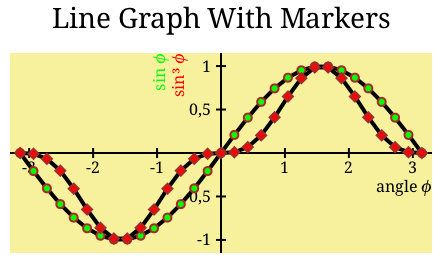
Code: Select all
' This is file ex_line_markers.bas
'
' Licence: GPLv3
' (C) 2012 Thomas[ dot ]Freiherr[ at ]gmx[ dot ]net
VAR root = goo_canvas_group_new(Glob, _
"line_width", line_group, _
NULL)
VAR title = goo_canvas_text_new(root, _
"<span size=""xx-large"">"_
"Line Graph With Markers" _
!"</span>\n", _
0.0, 0.0, W, GOO_CANVAS_ANCHOR_SW, _
"use_markup", TRUE, _
"alignment", PANGO_ALIGN_CENTER, _
NULL)
VAR grid = goo_canvas_rect_new(root, _
0.0, 0.0, W, H, _
"fill_color", "#F7F19E", _
"stroke_pattern", NULL, _
NULL)
VAR x = goo_axis_new(root, grid, Tx, GOO_AXIS_SOUTH, _
"text_align", PANGO_ALIGN_RIGHT, _
"offset", "-" & H / 2, _
"borders", "-3.3 3.3", _
"tick_length", "5 5", _
"ticks", "-3 -2 -1 1 2 3", _
NULL)
VAR y = goo_axis_new(root, grid, Ty, GOO_AXIS_WEST, _
"text_align", PANGO_ALIGN_RIGHT, _
"offset", "-" & W / 2, _
"text_offset", 0., _
"borders", "-1.15 1.15", _
"ticks", "-1 -.5 .5 1", _
"tick_length", "5 5", _
NULL)
VAR zz = goo_curve_new(root, x, y, Dat, 0, 2, 0, _
"marker_type", GOO_MARKER_CIRCLE, _
NULL)
goo_curve_set_markers_properties(zz, _
_ "stroke_color", "green", _
"stroke_color", "brown", _
"fill_color", "green", _
NULL)
VAR z = goo_curve_new(root, x, y, Dat, 0, 1, 0, _
"marker_type", GOO_MARKER_RHOMBUS, _
"marker_size", 10., _
NULL)
goo_curve_set_markers_properties(z, _
"stroke_color", "brown", _
"fill_color", "red", _
NULL)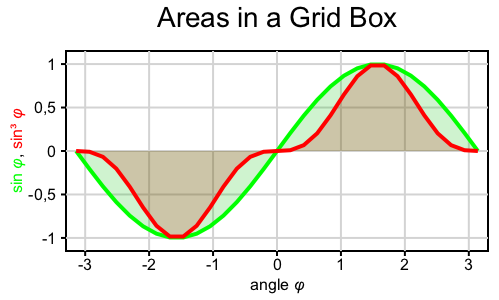 61 LOC:
Code: Select all
' This is file ex_box_area.bas
'
' Licence: GPLv3
' (C) 2012 Thomas[ dot ]Freiherr[ at ]gmx[ dot ]net

VAR root = goo_canvas_group_new(Glob, _
            "line_width", line_group, _
            "font", "Arial", _
             NULL)

VAR title = goo_canvas_text_new(root, _
            "<span size=""xx-large"">"_
            "Areas in a Grid Box" _
           !"</span>\n", _
            0.0, 0.0, W, GOO_CANVAS_ANCHOR_SW, _
            "use_markup", TRUE, _
            "alignment", PANGO_ALIGN_CENTER, _
             NULL)

VAR grid = goo_canvas_rect_new(root, _
            0.0, 0.0, W, H, _
            "line_width", line_group, _
             NULL)

VAR x = goo_axis_new(root, grid, Tx, GOO_GRIDAXIS_SOUTH, _
            "borders", "-3.3 3.3", _
            "ticks", "1", _
             NULL)

goo_axis_set_grid_properties(x, _
            "stroke_color", "lightgray", _
             NULL)

VAR y = goo_axis_new(root, grid, Ty, GOO_GRIDAXIS_WEST, _
            "text_offset", 7., _
            "borders", "-1.15 1.15", _
            "ticks", ".5", _
             NULL)

goo_axis_set_grid_properties(y, _
            "stroke_color", "lightgray", _
             NULL)

VAR zz = goo_curve_new(root, x, y, Dat, 0, 2, 0, _
            "stroke_color", "green", _
            "area", "y0", _
             NULL)

goo_curve_set_area_properties(zz, _
            "fill-color-rgba", &h00C00030, _
             NULL)

VAR z = goo_curve_new(root, x, y, Dat, 0, 1, 0, _
            "fill_color", "lightred", _
            "stroke_color", "red", _
            "area", "y0", _
             NULL)

goo_curve_set_area_properties(z, _
            "fill-color-rgba", &hC0000030, _
             NULL)
86 LOC:
Code: Select all
' This is file ex_3d_perpens.bas
'
' Licence: GPLv3
' (C) 2012 Thomas[ dot ]Freiherr[ at ]gmx[ dot ]net

VAR root = goo_canvas_group_new(Glob, _
            "line_width", line_group, _
             NULL)

VAR title = goo_canvas_text_new(root, _
            "<span size=""xx-large"">"_
            "3D Effect, Perpendiculars, Background Pixbuf" _
           !"</span>\n", _
            0.0, 0.0, W, GOO_CANVAS_ANCHOR_SW, _
            "font", "Purisa Bold Italic", _
            "use_markup", TRUE, _
            "alignment", PANGO_ALIGN_CENTER, _
             NULL)

VAR pixbuf = gdk_pixbuf_new_from_file("FreeBasic.png", 0)
VAR grid = goo_canvas_rect_new(root, _
             0.0, 0.0, W, H, _
            "stroke_color", "yellow", _
            "fill_color", "lightyellow", _
            "line_width", line_group, _
             NULL)

VAR image = goo_canvas_image_new(root, _
            pixbuf, _
            0.0, 0.0, _
            "width", W, _
            "height", H, _
            "scale-to-fit", TRUE, _
             NULL)

VAR x = goo_axis_new(root, grid, Tx, GOO_AXIS_SOUTH, _
            "stroke_color", "yellow", _
            "fill_color", "yellow", _
            "offset", "25 27", _
            "borders", "-3.3 3.3", _
            "tick_length", "0.01", _
            "tick_angle", -30.0, _
            "ticks", "1", _
             NULL)

goo_axis_set_ticks_properties(x, _
            "stroke_color", "black", _
             NULL)

goo_axis_set_text_properties(x, _
            "fill_color", "black", _
             NULL)

VAR y = goo_axis_new(root, grid, Ty, GOO_AXIS_EAST, _
            "stroke_color", "yellow", _
            "fill_color", "yellow", _
            "offset", "25 -27", _
            "text_offset", 7., _
            "borders", "-1.15 1.15", _
            "ticks", ".5", _
            "tick_length", "0.01", _
            "tick_angle", -30.0, _
             NULL)

goo_axis_set_ticks_properties(y, _
            "stroke_color", "black", _
             NULL)

goo_axis_set_text_properties(y, _
            "fill_color", "black", _
             NULL)

VAR zz = goo_curve_new(root, x, y, Dat, 0, 2, 0, _
            "stroke_color", "green", _
            "perpendiculars", "C1", _
             NULL)

goo_curve_set_perpens_properties(zz, _
            "stroke_color_rgba", &hC0C0C090, _
             NULL)

VAR z = goo_curve_new(root, x, y, Dat, 0, 1, 0, _
            "stroke_color", "red", _
             NULL)

goo_canvas_item_set_simple_transform(root, W / 2, h / 2, 1.0, 30.0)- A) using this library,
B) participating in the project?
- beta-testers with good ideas how to make the API more powerful and easier to use
- authors for the documentation
- programmers keen on (or able and willing to learn) GLib, Cairo, GooCanvas, ...
- an PR expert for creating and maintaining a website with repository and Wiki (ie at sourceforge)
